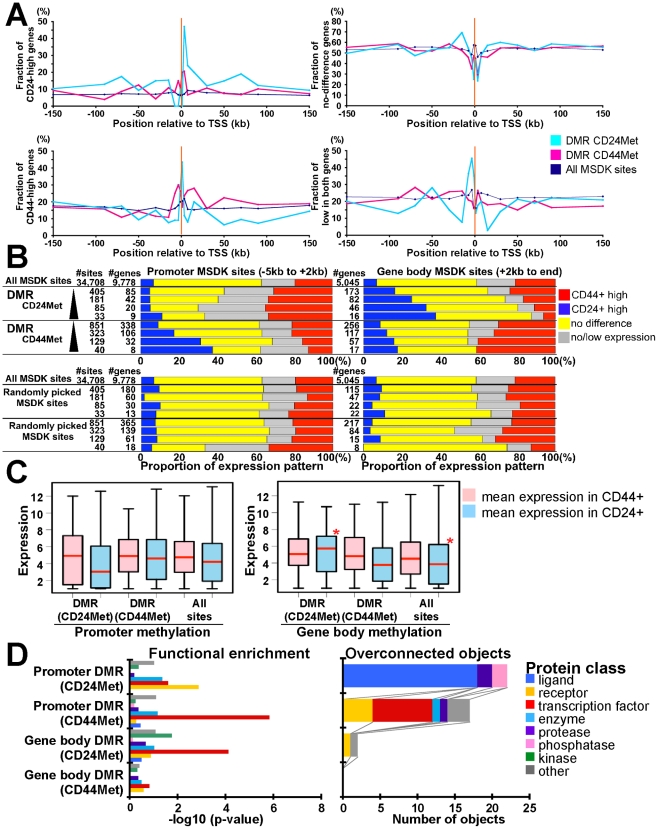
Figure 6. Combined view of DNA methylation and gene expression patterns.
(A) Associations between fraction of genes highly expressed in CD24+ or CD44+ cells and the location of DMRs (p<10−5) in the two cell types relative to TSS. Y-axes show fraction of genes in the four different gene expression groups (i.e. CD24-high, CD44-high, no difference, and not expressed) relative to the location of DMRs hypermethylated in CD24+ (blue line) or CD44+ (red line) cells and all MSDK sites used as control. (B) Differentially (≥2-fold difference) expressed genes are enriched in DMRs. Bar charts show associations between genes with indicated DMR and gene expression patterns as described in panel A. Genes in each gene set have DMR (indicated left side) within promoter region (−5 kb from TSS to +2 kb, left panel) or in gene body (+2 kb to end, right panel). The number of MSDK sites and associated genes in each group is indicated. We used four different cut-offs for DMRs, 2, 5,10, 20 (-log10 p-value) from top to bottom (black triangle). Randomly picked MSDK sites did not show any enrichment pattern. (C) Correlation between mean gene expression levels in relation to promoter and gene body methylation in CD24+ and CD44+ cells. Red stars mark statistically significant differences relative to all MSDK sites. (D) Functional enrichment analysis (left panel) of genes associated with promoter and gene body DMRs in CD24+ and CD44+ cells and the number of overconnected objects in each functional category within each group (right panel). X-axis indicates –log10 p-values for enrichment with the indicated protein class (left panel) and the number of objects (right panel), respectively. Definitions are the same as described in Figure 3D.

