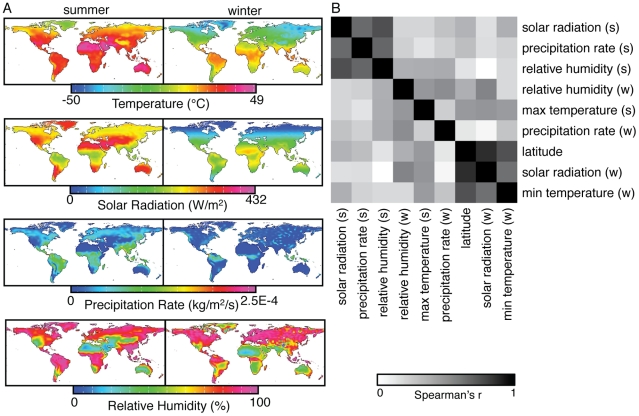
Figure 1. Climate variables used for the analysis.
(A) Maps show the distributions of summer and winter climate variables: maximum summer temperature, minimum winter temperature and solar radiation, precipitation rate and relative humidity in the summer and winter. (B) A heatmap shows the absolute values of Spearman rank correlation coefficients between pairs of climate variables.

