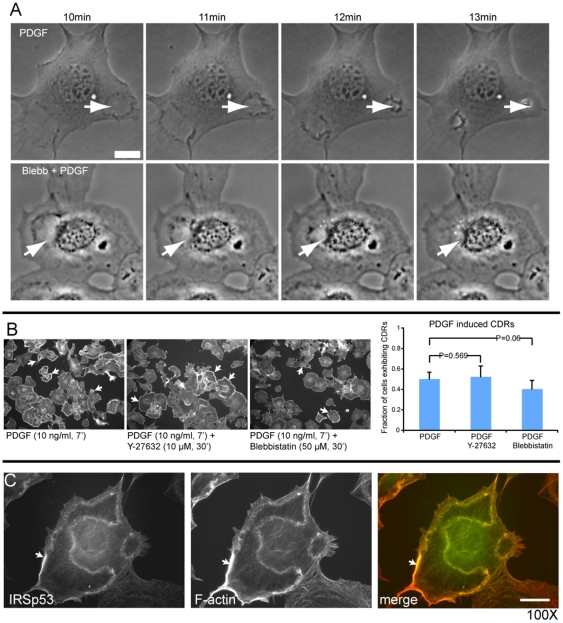
Figure 1. Experimental results.
Experiments done in MEF cells which are stimulated by PDGF. (A) Time-lapse of CDRs dynamics. Still images of MEF cells serum-starved and pre-treated with vehicle (upper panels) or Blebbistatin (lower panels) and subsequently treated with PDGF to induce CDRs formation. CDR dynamics were recorded by time-lapse video microscopy (see also Movie S1 and Methods section). Bar, 20  m. (B) The fraction of cells exhibiting CDRs is unaffected by treatment with two different myosin II inhibitors. P-values show no statistical significance. (C) IRSp53 is localized at CDRs. IRSp53 marked in green and actin in red. Bar 10
  . Arrows denotes CDRs.

