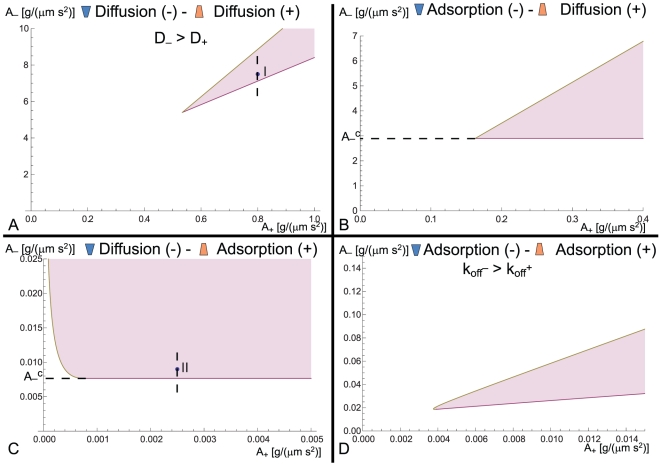
Figure 3. Wave instability phase diagram in the  –
– plane.
Regions marked in pink denote the unstable waves. (a) the diffusion(−)–diffusion(+) model, when  . (b) the adsorption(−)–diffusion(+) model. (c) the diffusion(−)–adsorption(+) model. (d) the adsorption(−)–adsorption(+) model when
  . In (a) and (c) the dashed line marks the values along which the bifurcation graph (Fig. 5) was plotted. In (b) and (c) the threshold value of
  is denoted by
  .
.

