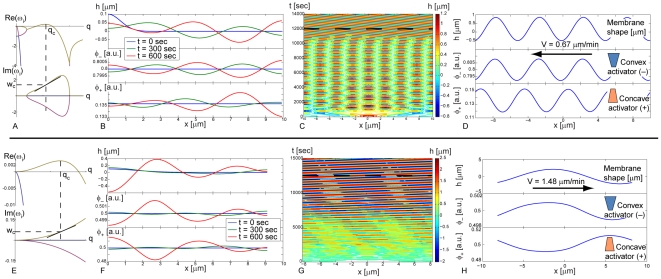
Figure 4. Linear stability and simulation results.
(a–d) Results of the diffusion(−)–adsorption(+) system. (a) Dispersion relation of point marked II in Fig. 3c. Vertical dashed line mark  and horizontal dashed line marks
  . The slope of the imaginary part of the dispersion relation at
  gives us an estimate of the group velocity of the waves
  . (b) Simulation for short times. One can see that the convex activators are in-phase with the membrane while the convex activators are in anti-phase. Due to symmetry only half of the domain is shown. (c) Kymograph depicting the membrane height displacement as a function of space and time. (d) Steady state wave at time t = 12,500 sec (marked by the dashed line in (c)). Arrow shows direction of propagation. (e–h) Results of the diffusion(−)–diffusion(+) system. (e) Dispersion relation of point marked I in Fig. 3a. Vertical dashed line marks
  and horizontal dashed line marks
  . (f) Simulation for early times (as in (b)). (g) Kymograph depicting the membrane height displacement as a function of space and time. (h) Steady state wave at time t = 12,000 sec (marked by the dashed line (g)). Arrow shows direction of propagation. The simulations are shown in Movies S2 and S3 respectively.

