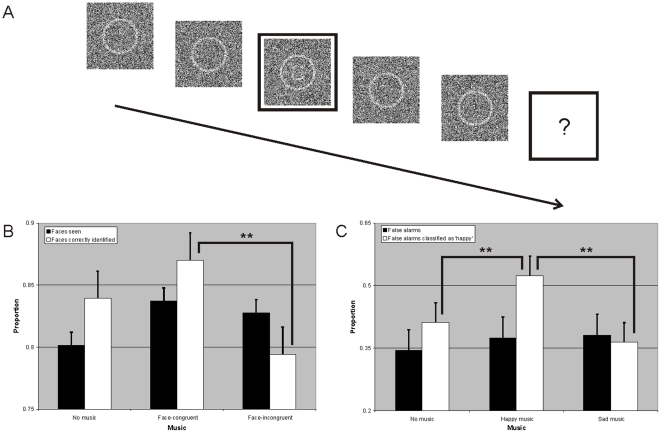
Figure 1. Experimental design and results.
a. Schematic of a single trial. Patches of noise were presented for 107 ms, creating an animation of dynamic noise; the middle patch contained either a face stimulus or just noise and was accompanied by an annulus surrounding the patch. After the trial, observers had to indicate whether they had seen a happy, a sad or no face. b. Proportions of real faces seen (black bars) and correctly identified emotional expressions (white bars). Error bars indicate 1 S.E. (n = 42), asterisks (**) indicate significant difference at p<.001. c. Proportions of reported false alarms (black bars) and proportion false alarms classified as happy (white bars). Error bars indicate 1 S.E. (n = 42), asterisks (**) indicate significant difference at p<.001.

