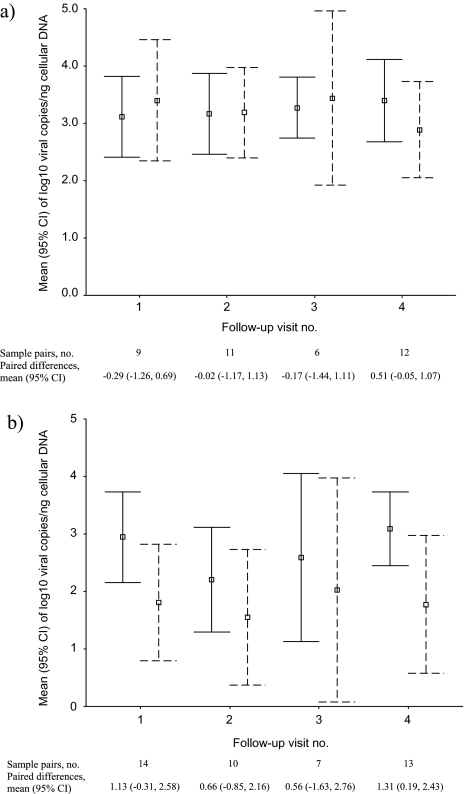
Figure 2.
Mean (square) and 95% confidence interval (upper and lower bound) of log10 human papillomavirus type 16 E7 copies per 1 nanogram (ng) of cellular DNA detected in enrollment (solid line) and follow-up (dashed line) samples among case patients (Figure 1A) and control subjects (Figure 1B), stratified by the follow-up visits from which samples were assayed for viral load.

