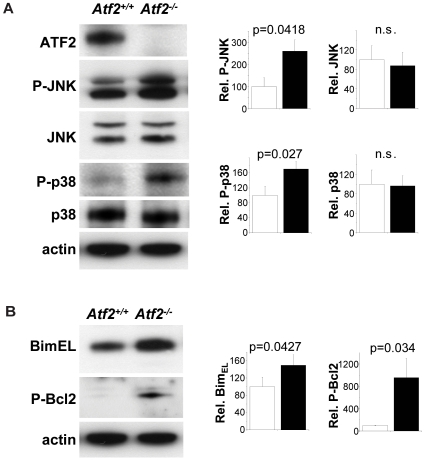
Figure 7. Up-regulation of P-JNK and P-p38 in Atf2 − /− hindbrains.
(A) Western blot analysis shows increased P-JNK (Thr183/Tyr185) and P-p38 (Thr180/Tyr182) in Atf2−/− compared to Atf2+/+ E14.5 hindbrains extracts. (B) Expression levels of BimEL and P-Bcl2 (Ser70) are shown. Bar graphs show relative signal intensity between Atf2+/+ (white bars) compared to Atf2−/− (black bars). Significance values (p) were determined from 3 independent samples using Student's t-test.

