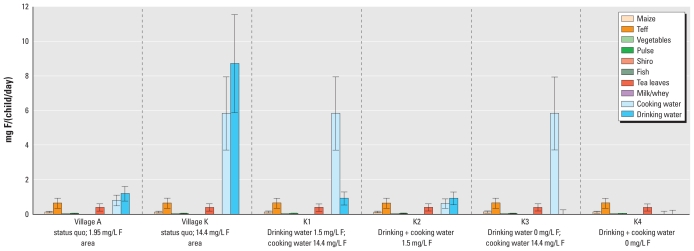
Figure 3.
Daily estimated mean ± SD fluoride (F) intakes contributed by ingredients used in children’s food and drinks: results according to observed fluoride concentrations in water sources for villages A and K and for four scenarios in village K (K1–K4). Foods such as fish sauce were not consumed during the period observed but are part of the diet.

