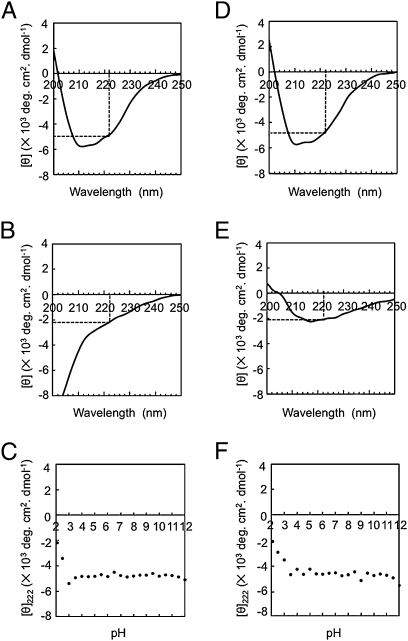
Fig. 5.
CD spectra of the curcumin-converting enzyme and the ellipticity in different pH values. The CD spectra of CurA treated in 10-mM Britton-Robinson buffer pH 6.0 (A) and pH 2.1 (B); 0.1 mg/mL of the purified enzyme was treated at different pH values in 10-mM Britton-Robinson buffer and CD spectra were measured. The mollar ellipticity (θ) was then calculated for the different pHs. θ222 was denoted by dotted line. (C) θ222 at different pH values. The CD spectra of CurA after the pH was shifted from 6.0 to 6.0 (D) and from 2.1 to 6.0 (E); 0.1 mg/mL of the purified enzyme was treated at different pH values in 10-mM Britton-Robinson buffer and then shifted to the usual pH 6.0 using 40-mM Britton-Robinson buffer (pH 6.0), and then the CD spectrum was measured and θ222 was denoted by a dotted line. (F), θ222 after the pH had been shifted from various values to 6.0.

