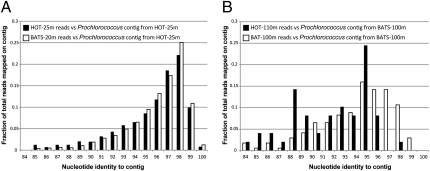
Fig. 1.
Comparing Prochlorococcus populations from HOT and BATS. Graphs show the coverage plots, performed essentially as described previously (4), of a high-light adapted Prochlorococcus contig assembled from HOT-25m (A) and BATS-100m (B) 454 shotgun datasets by selected 454 datasets (figure key). The contigs represent the population that makes up more than 80% of the total high-light adapted Prochlorococcus population within each sample. Note that the two surface populations (i.e., HOT-25m and BATS-20m) are indistinguishable from each other when compared against the same reference contig from HOT-25m (A). However, the populations from deeper waters are clearly differentiated/divergent from each other when compared against the reference contig from BATS-100m (B). These results indicate that the deep population within each site is probably heterogeneous [i.e., composed of different subpopulations (ecotypes)] and not identical (and directly comparable) between BATS and HOT. Contigs are available by the authors upon request.

