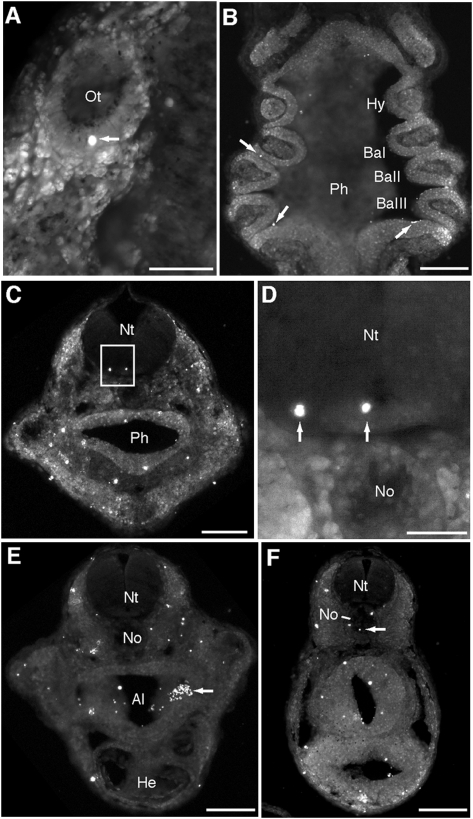
Fig. 2.
Distribution of algal cells in salamander embryos. (A and B) Coronal and (C–F) transverse vibratome sections imaged for chlorophyll autofluorescence. Boxed region in C shown in higher magnification in D. Arrows indicate autofluorescent algal cells. Individual algae were embedded in (A) the otic capsule (Ot); (B) the pharynx (Ph) and pharyngeal clefts; (C and D) several regions of the head, including the neural tube (Nt); and several regions of the anterior (E) and posterior trunk (F), including the alimentary canal (Al) and notochord (No). Ba, branchial arch; He, heart; Hy, hyoid arch. (Scale bars: 100 μm in A and D; 1 mm in B, C, E, and F.)

