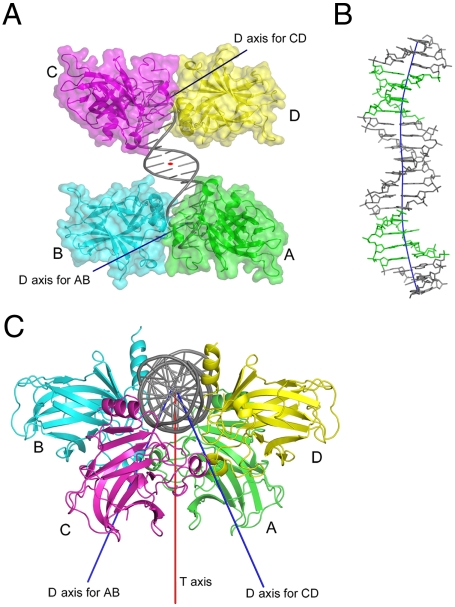
Fig. 4.
(A) A view of the p63DBD in complex with the 22-bp DNA, down the T axis (shown as a red oval at the center of the DNA). Two D axes are depicted, one for each dimer. There is no interdimer contact in this structure. (B) Structure and the trajectory of the 22-bp response element, showing that the DNA is bent. The DNA is shown in a stick model and colored in gray except that the CATG core regions are highlighted in green. The DNA trajectory is colored in blue. (C) Top view of the complex, showing the 48° crossing orientation of the two dimers and the two D axes oriented 24° with respect to the T axis.

