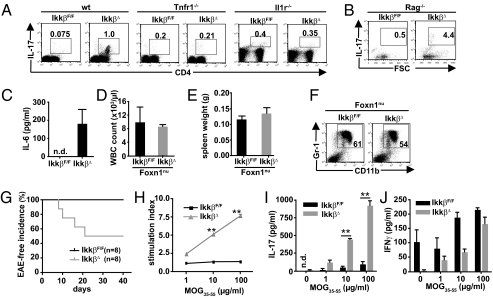
Fig. 5.
IkkβΔ mice develop a strong Th17 polarization and show increased susceptibility to develop EAE (A and B) Representative FACS plots of IL-17–secreting CD4+ cells in mesenteric lymph nodes of IkkβF/F, IkkβΔ, Tnfr1−/−, and IkkβΔ/Tnfr1−/−, Il1r−/−, and IkkβΔ/Il1r−/− double KO mice (A), as well as IL-17–secreting cells in Rag1−/− and IkkβΔ/Rag1−/− compound mutants (B). Plots are representative of at least four animals per genotype. (C) Plasma IL-6 levels in IkkβF/F and IkkβΔ mice. Data are mean ± SE from at least six mice (n.d., not detected). (D and E) WBC counts (D) and spleen weights (E) of NU-Foxn1nu and NU-Foxn1nu/IkkβΔ double KO mice. Data are mean ± SE from at least three mice. (F) Representative FACS plots of CD11b+/Gr-1+ cells in bone marrow of NU-Foxn1nu and NU-Foxn1nu/IkkβΔ double KO mice. Plots are representative of at least three animals per genotype. (G) Incidence of EAE in IkkβF/F (black line) and IkkβΔ (gray line) mice injected with MOG35–55 peptide (*P < 0.05 by log-rank test). (H) Proliferation of peripheral lymph node cells from IkkβF/F (black line) and IkkβΔ (gray line) mice restimulated with increasing amounts of MOG35–55 peptide 12 d after first exposure. Data are mean ± SE from at least three mice (**P < 0.01). (I and J) IL-17 and IFN-γ levels in supernatants from peripheral lymph node cells of IkkβF/F (black line) and IkkβΔ (gray line) mice 48 h after stimulation with increasing amounts of MOG35–55 peptide 12 d after first exposure. Data are mean ± SE from at least three mice (**P < 0.01).

