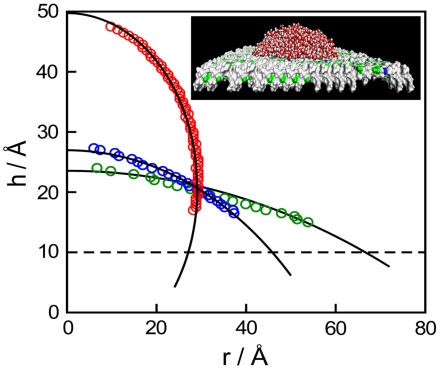
Fig. 4.
Typical drop profiles for several types of protein surfaces. The circles represent the data points for surface types A (green), B (red), and mixed A/B at 50% (blue). Black solid lines are fitted to simulated data, and the dashed line denotes the height of flattened protein surfaces. (Inset) Nanodrop geometry used in water contact angle calculations on a mixed A/B surface.

