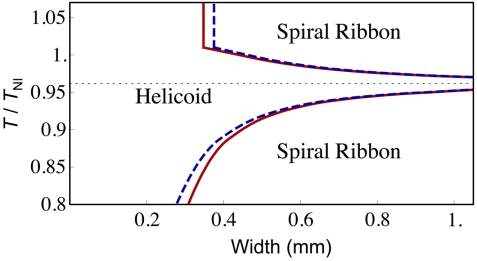
Fig. 6.
Theoretical Phase diagram of TNE ribbons in the width-temperature space. The ribbon thickness is 35.2 μm. The phase boundary of the L-geometry and the S-geometry is represented, respectively, by the red solid line and the blue dashed line. The handedness of the formed ribbons changes as the dotted line at Tflat/TNI = 0.962 is crossed.

