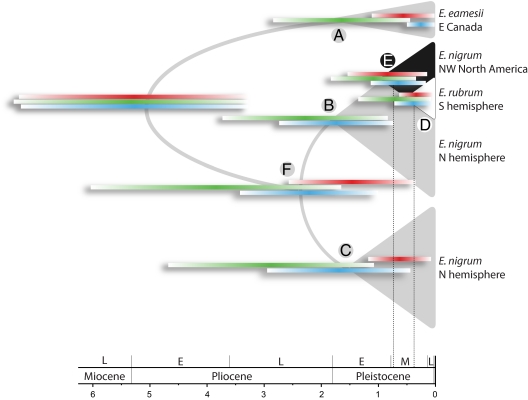
Fig. 2.
Schematic phylogeny of E. eamesii, E. nigrum, and E. rubrum inferred from three DNA regions (Figs. S2–S4). Colored bars indicate the 95% HPD age interval for clades A–F inferred from the plastid trnfMCAU-trnSUGA and trnSGCU-trnGUUC regions (red), the nuclear region spanning exons 31–32 in RPC2 (green), and the nuclear region spanning exons 2–6 in RPB2-I (blue). See Table 1 for posterior probabilities and ages inferred from each DNA region for clades A–F. Note that the B and E clades coincide in the plastid tree (Fig. S2), and the red 95% HPD bar at clade E can also be placed at clade B. The timescale shows absolute age in million years. Holocene is not indicated. Dashed vertical lines indicate the average median time to the most recent common ancestor of the southern hemisphere E. rubrum (clade D) and its closest relative from the northern hemisphere, northwestern North American E. nigrum (clade E), estimated from all three DNA regions.

