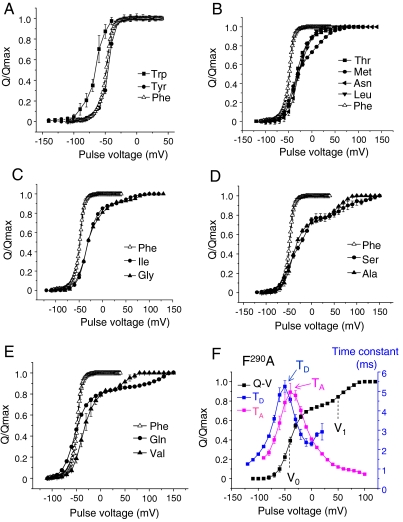
Fig. 2.
F290 mutations affect a late gating transition of the voltage sensor. (A–E) Gating currents were induced by pulsing from a negative voltage (-120 to -140 mV) to incremental more positive voltages and integrated at the repolarizing pulse. The plots show the Q - V curves depending on the residue at position F290. The substituted residues are (A) Trp (full squares) and Tyr (full circles); (B) Thr (full squares), Met (full circles), Asn (full left triangles), and Leu (full down triangles); (C) Ile (full circles) and Gly (full up triangles), (D) Ser (full circles) and Ala (full up triangles), and (E) Gln (full circles) and Val (full up triangles). In each graph, the Q - V curve of the wild-type F290 control is displayed as open up triangles. The data are representative of at least five independent experiments for each mutant. (F) Typical gating current analysis depicted for the F290A mutation. The Q - V curve (full squares) was fitted to a sum of two Boltzmann distributions (see SI Text), giving the V0 and V1 values that are the midpoint values of the two gating charge components. The gating current time constants were measured during activation (magenta squares) and deactivation (blue squares) and plotted as a function of the voltage pulse. The maximum time-constant values are noted TA and TD.

