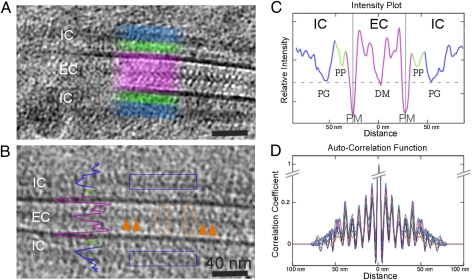
Fig. 1.
Ultrastructure of the desmosome from human epidermis. (A) Two-dimensional projection image of a straight desmosome shows the periodic structure in extracellular and intracellular regions. The extracellular desmosomal cadherins appear as electron-dense protrusions extending from the plasma membrane (PM) to a dense midline (DM), showing a pronounced periodicity (purple boxed area). At the intracellular region (IC), two layers with different levels of intensity (green and blue highlighted area) can be observed, corresponding to the plakophilin and plakoglobin layers. (B) A 6-nm-thick tomographic slice shows details of the desmosomal interactions in extracellular and intracellular spaces. cis interactions (cadherin emanating from the same cell) are highlighted by the orange arrows; trans interactions (cadherins emanating from juxtaposed cells), with the characteristic “W” shape, are boxed in the orange areas. The density profile of C is indicated on the image. (C) Graph of relative density as projected orthogonally to the normal of the plasma membrane (in three different colors corresponding to the different regions of the desmosome). The plasma membranes have the highest density, followed by the plakoglobin (PG) layer with a similar density to the dense midline, and finally the plakophilin (PP) layer with the lowest density. The comparable densities between the plakoglobin layer and the dense midline indicate a similar number of proteins clustering at these regions. (D) Superimposed autocorrelation function calculated at various positions of the desmosomal plaque (indicated with blue box in B) shows that the plaque has a periodicity of approximately 7 nm, which matches that of the extracellular region. (Scale bars: A and B, 40 nm.)

