Fig. 2.
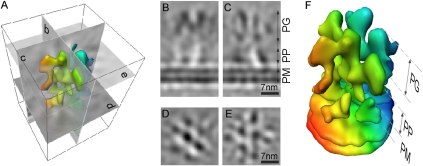
Three-dimensional average of desmosomal plaque. (A) Illustration shows isosurface of the 3D average (350 subtomograms) of the intracellular part of the desmosome and the computational sections along the three axes visualized in B–E. (B) Coronal slice (0.6 nm thick) through the subtomogram average (as indicated by the letters in the illustration) show that the molecules in the plakoglobin layer form a zigzag pattern. The plakoglobin layer does not have obvious connections to the plakophilin layer. The area between the two regions appears smooth, electron-lucent, and unstructured. (C) Sagittal slice (0.6 nm thick) through the subtomogram average. The cross-sections of two molecules are shown, showing a remarkable similarity to the cross-sections of plakoglobin molecules. (D and E) Two 0.6-nm-thick axial slices through the plakophilin and the plakoglobin layers, respectively (E and F). A clear periodicity can be observed in both layers. Superposition of the two layers shows that the molecules in the plakophilin layer are shifted with respect to the plakoglobin layer, and are hence accessible from the cytoplasmic side. (E) Interconnections between the various molecules are visible. (Scale bars: 7 nm.) (B) The isosurface of the subtomogram average shows three distinct density layers, colored in three different colors: the plasma membrane (PM) and the plakophilin (PP) and plakoglobin layers (PG). The threshold is chosen so that the thickness of the central densities corresponding to the plakoglobin molecules is approximately 3.5 nm. The color coding varies as a function of the depth from red to blue. Individual layers are labeled with similar color. The interacting molecules form a zigzag pattern and are arranged in consecutive layers.

