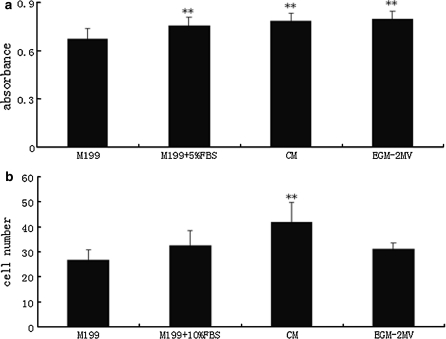
Fig. 3.
MNCs induced by different culture conditions showed differences in biological properties. Data are presented as the mean ± SD n = 5 (All **p < 0.01 vs. M199 group). a The proliferative ability of MNCs in different culture media (y-axis: Absorbance at 492 nm—MTT proliferation assay). b The adherence ability of MNCs in different culture media (10000 cells were seeded on fibronectin-coated plates in different media. Cell number (y-axis) is the average of four fields which were counted under microscope (magnified 200x)).

