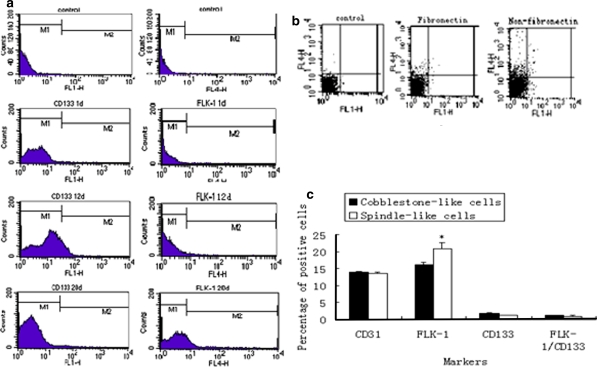
Fig. 4.
Flow cytometric analysis of surface markers of EPCs differentiated from rat bone marrow MNCs. Data are presented as the mean ± SD, n = 3 (*p < 0.05, **p < 0.01). a The expression of EPC markers change over time in culture, corresponding percentage in Table 1. b Detection of EPC markers in rat bone marrow-derived MNCs plated on either fibronectin-coated dishes or non-fibronectin-coated dishes, corresponding percentage in Table 2. The expression of CD133 and FLK-1 were separately detected using FL-1H and FL-4H, respectively. Control represents negative control without primary antibody incubation. c The expression of biomarkers in cobblestone-shaped cells and spindle-shaped cells, corresponding percentage in Table 3

