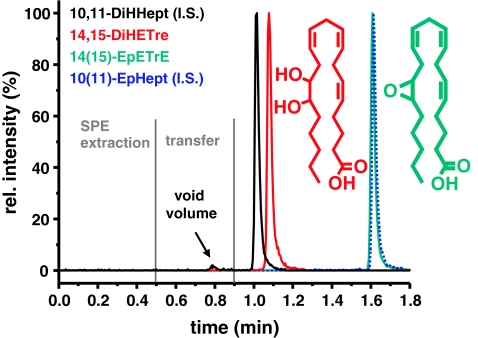
Fig. 1.
SRM chromatogram obtained from the online SPE–LC–MS/MS system. The signals of the product 14,15-DiHETrE (black line at 0.9 min) and its I.S. 10,11-DiHHep (red line at 1.0 min) and the co-eluting substrate 14(15)-EpETrE (green) and its I.S. 10(11)-EpHHep (dashed blue line) at 1.6 min are shown after injection of 20 μL standard solution containing 100 nmol L−1 of the compounds. The relative intensity (y-axis) of each SRM transition is shown normalized to 100% intensity. The structure of the analytes is depicted beside of the peaks

