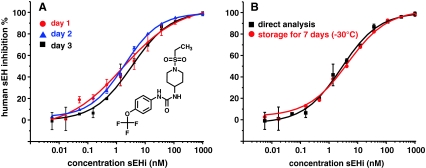
Fig. 2.
Reproducibility and robustness of the method. Shown are the dose–response curves for sEHI 1. a Means of three independent determinations on three different days, using two different batches of substrate and enzyme. b Comparison of a direct measurement after incubation and after 7 days storage at −30 °C. The structure of the inhibitor is shown in panel A

