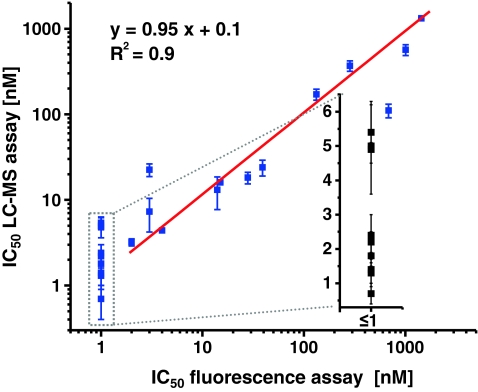
Fig. 4.
Correlation of measured IC50 values between the newly developed LC–MS approach and the high-throughput fluorescence assay. The linear regression for inhibitors with IC50 > 1 nmol L−1 in the florescence assay is shown in grey. The LC–MS assay results for potent inhibitors (fluorescence assay ≤ 1 nmol L−1) is shown enlarged in the inset, demonstrating that the fluorescence assay cannot distinguish among the most potent sEHI

