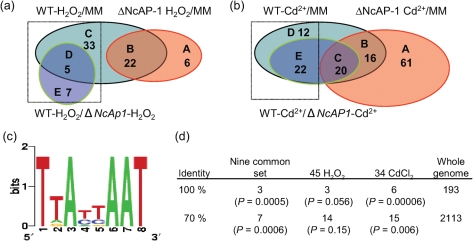
Fig. 3.
The NcAp-1 regulon. (a) Venn diagram showing the overlap among the genes that showed statistically significantly increased expression levels in the WT (FGSC 2489) as compared with the ΔNcAp-1 mutant when exposed to H2O2. Genes within C, D and E represent genes that were induced by exposure to H2O2 and were NcAp-1-dependent. (b) Venn diagram showing the overlap among the genes that showed statistically significantly increased expression levels in the WT (FGSC 2489) as compared with the ΔNcAp-1 mutant when exposed to CdCl2. Genes within D and E represent genes that were induced by exposure to CdCl2 and were NcAp-1-dependent. (c) WebLogo of the cis-element that showed enrichment in the putative direct target genes of NcAp-1 (see Methods) (http://weblogo.berkeley.edu/logo.cgi). (d) Enrichment analysis of predicted cis-elements in the NcAp-1 target gene set. Using the predicted cis-element as an input matrix, the 1000 bp upstream of the predicted target genes was evaluated by paster (Hertz & Stormo, 1999). The perfect match and 70 % match to the cis-element are shown; statistical analysis (P values) was conducted by Fisher's exact test.

