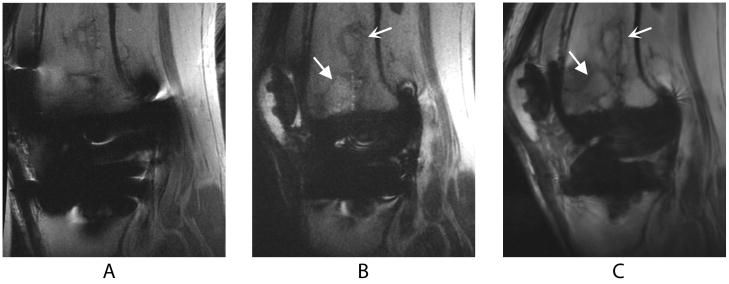
Figure 2.
Sagittal images of a TKR produced by FSE (a), SEMAC (b), and MAVRIC (c) MRI pulse sequences in a volunteer who presented with knee pain at the time of scanning. The bone infarct (curved arrow) and presumed stress fracture (wedge-shaped arrow) are clearly seen on the SEMAC and particularly the MAVRIC images, but distortion obscures part of the fracture on the FSE image. The different apparent signal-to-noise ratios in these images can be attributed to the SEMAC image being combined using a linear, rather than a sum-of-squares, reconstruction.

