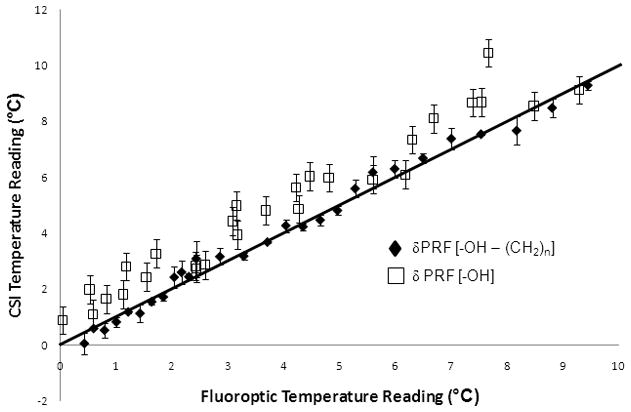
Figure 3.

The temperature measurements from the CSI technique compared to the true temperature calculated by the fluoroptic probe. The RMSE for the susceptibility-corrected temperature readings and the water PRF readings were 0.393 °C and 1.031 °C. The slopes of the regression lines for the water-lipid temperature readings and the water PRF 0.999 (R2=0.987) and 0.988 (R2=0.942) with intercepts at 0.030°C and 1.014°C, respectively. For comparison, the line shown in the figure has a slope of unity.
