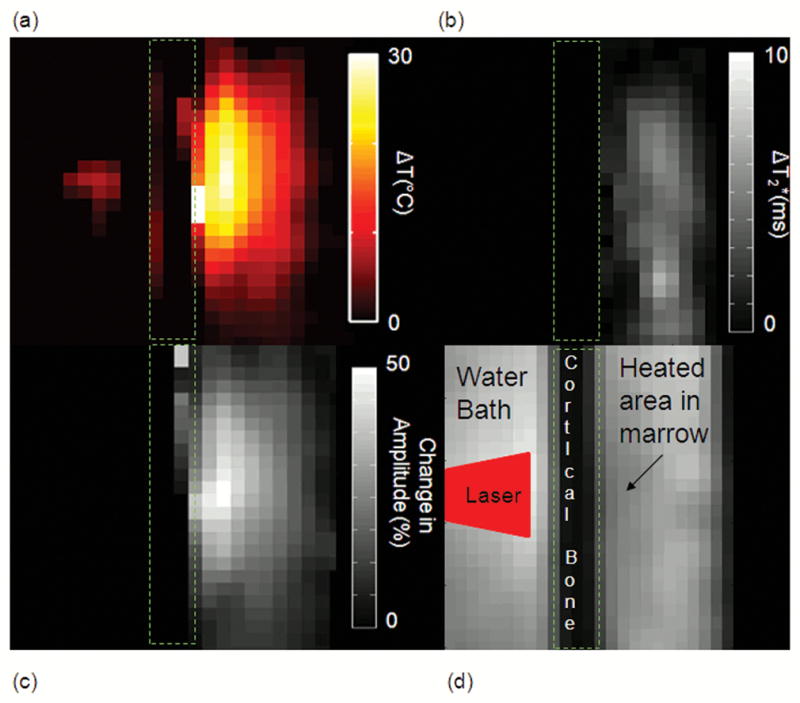
Figure 4.

(Fig. 4a) Temperature map of the external laser ablation at 3.0T using the bulk methylene as the internal reference. This map is at 110 seconds into treatment. Cumulative difference in the water T2* (Fig. 4b) and amplitude (Fig. 4c) at the same time point. These two images were inverted to show positive contrast to decreasing signal (Fig. 4d) The T1-W image at the same time point shows a signal hypointensity at the site of heating. The location of the laser beam is also illustrated.
