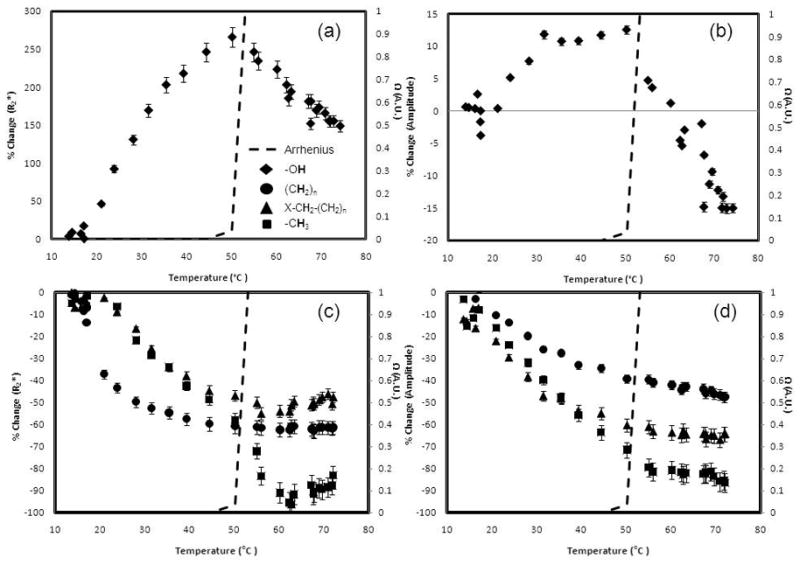
Figure 5.

The water R2* (Fig. 5a) and amplitude (Fig. 5b) as well as the lipid R2* (Fig. 5c) and amplitude (Fig. 5d) at 3.0T. The dashed line in each plot represents the Arrhenius dose model calculation (A: 3.1 x 1098 s−1, Ea: 6.3 x 10⁵ J mol−1) (23). Changes in the slope can be seen when the Arrhenius dose, Ω, approaches 1.0, which signifies damage to the tissue.
