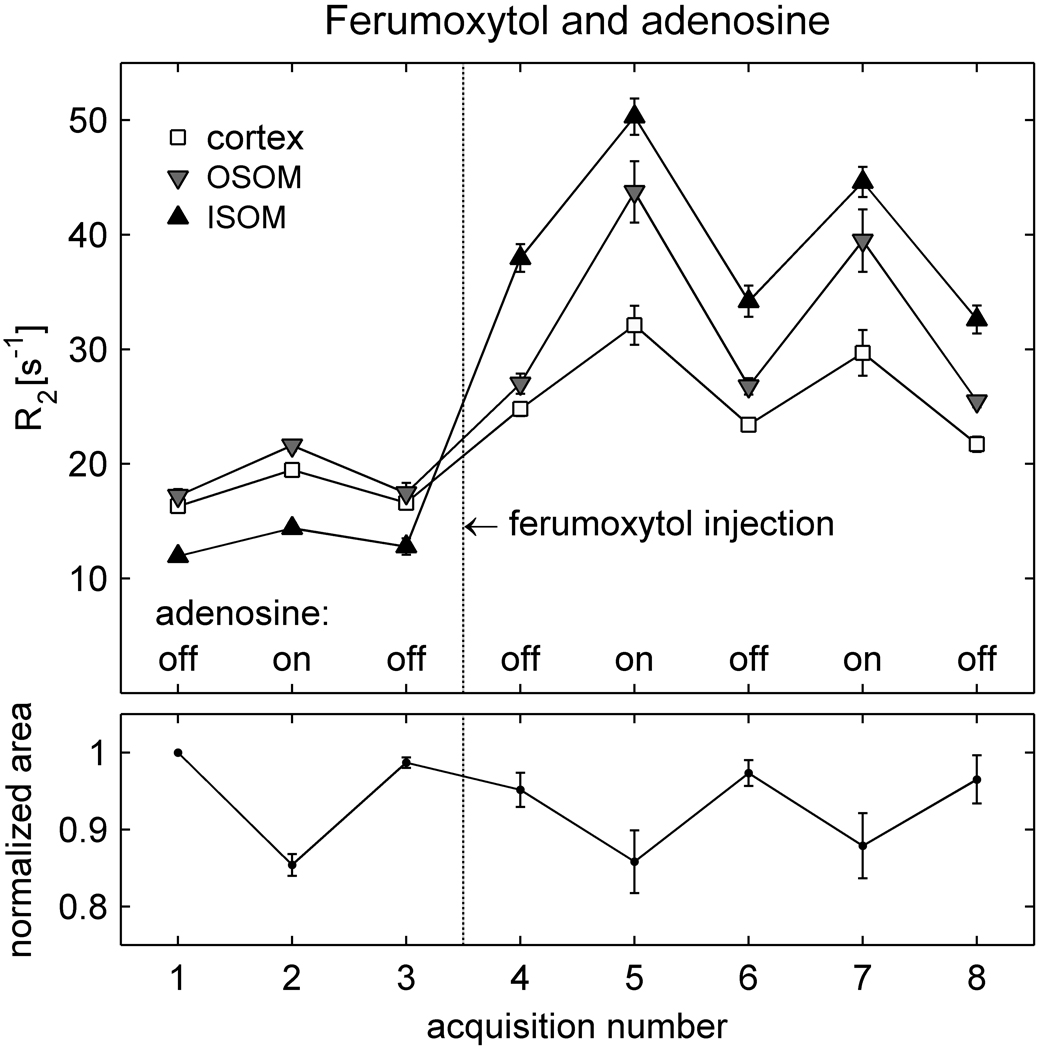
Figure 2.
Averaged results (mean ± SEM) from the animals in group I-a (N = 6), which received adenosine and ferumoxytol. The upper graph shows mean R2 values in the cortex, OSOM and ISOM over the course of the experiment. Adenosine infusion was switched on and off between successive acquisitions, both prior to ferumoxytol administration (acquisitions 1 – 3) and after ferumoxytol administration (acquisitions 4 – 8). The lower graph shows the area of the kidney, normalized to its value in acquisition 1, and averaged over all animals. The results for acquisition 6 – 8 were averaged over only 5 animals, since one rat was withdrawn from the scanner after acquisition 5 due to respiratory distress. As in Figure 1, R2 increases with ferumoxytol administration (acquisition 4) and increases further with adenosine (5 and 7). Adenosine also produces a slight increase in R2 in the absence of ferumoxytol (acquisition 2) and causes a reduction in the cross-sectional area of the kidney (acquisitions 2, 5 and 7).

