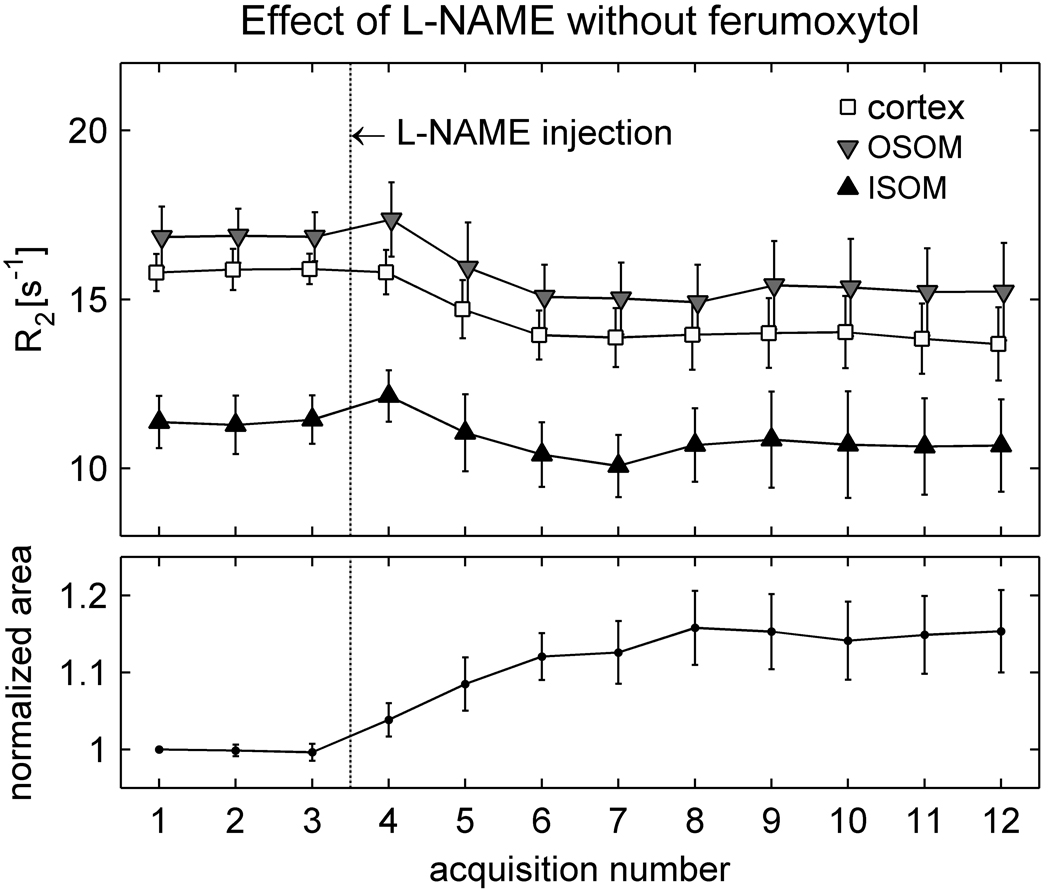
Figure 5.
Averaged results (mean ± SEM) from the control animals in group II-c (N = 4), which received l-NAME in the absence of ferumoxytol. The points corresponding to different regions in the upper graph have been slightly offset horizontally from each other so that the error bars do not overlay. Following l-NAME injection, R2 decreases on average in all regions while the kidney area increases. As in Figure 4, however, the responses are not immediate.

