Figure 2.

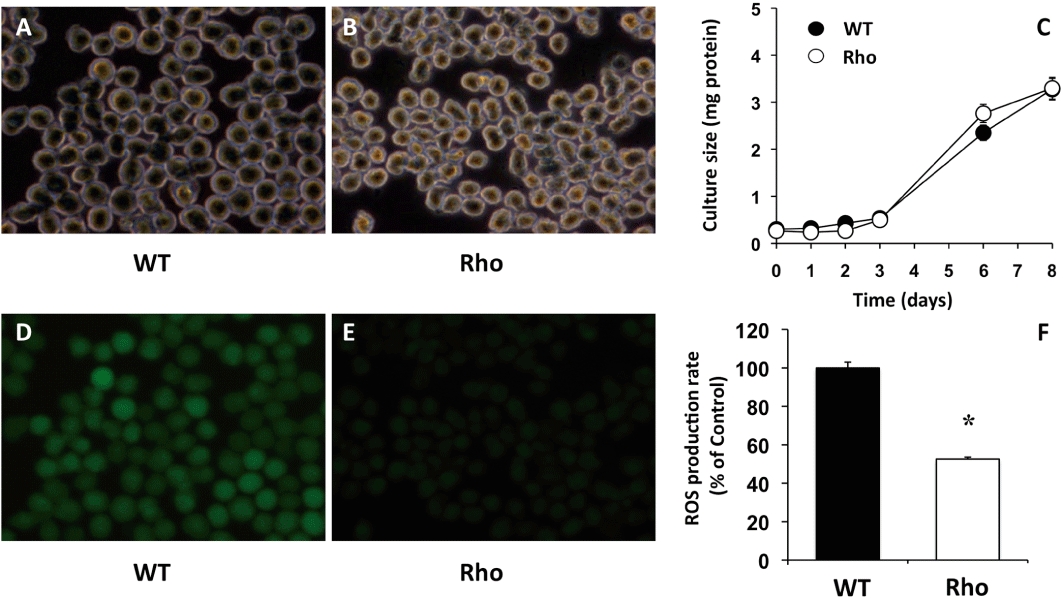
Representative photographs of phase-contrast (A,B) and fluorescence (D,E) microscopy of wild-type (WT) (A,D) and mtDNA-depleted (Rho) (B,E) Hepa 1–6 mouse hepatoma cells incubated with 5 µg·mL−1 DCFH-DA for 1 h. The rate of cell growth was measured by total protein content (C). Fluorescence was measured to determine ROS production (D,E,F). Values are expressed as mean ± SEM from five cultures measured in triplicate for each data point. *P < 0.05, significant differences between WT and Rho cells.
