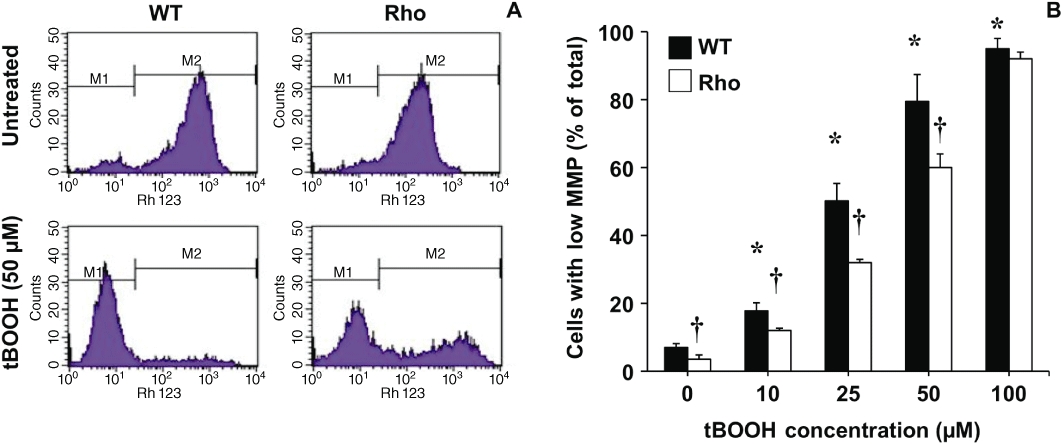
Figure 5.

Representative histograms obtained with flow cytometry to determine mitochondrial membrane potential (MMP) after incubating wild-type (WT) and mtDNA-depleted (Rho) Hepa 1–6 mouse hepatoma cells with 5 μg·mL−1 rhodamine 123 for 1 h. Two populations of cells with either low (M1) or high (M2) MMP were identified (A). Proportion of cells with low MMP after treating the culture with the indicated concentrations of tert-butyl hydroperoxide (tBOOH) for 5 h (B). Values are mean ± SEM from five cultures measured in triplicate for each data point. *P < 0.05, significantly different from untreated WT cells; †P < 0.05, significant differences between Rho with WT cells.
