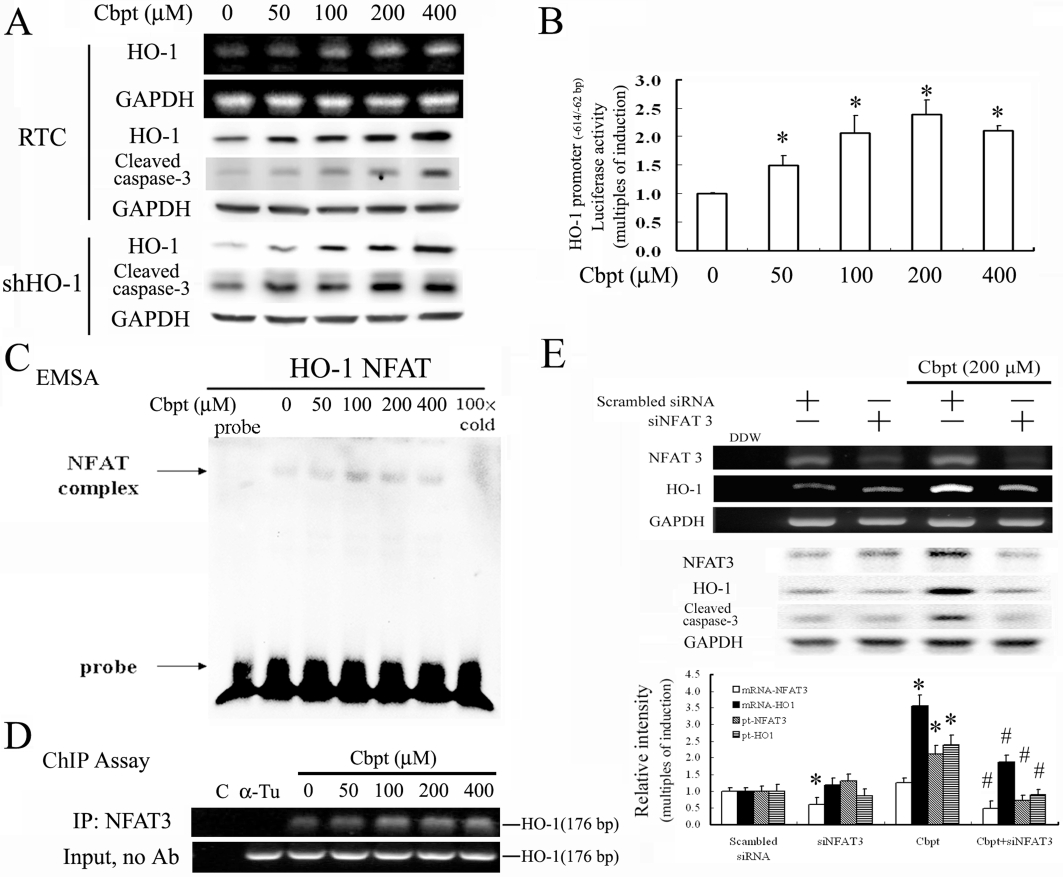
Figure 7.

Carboplatin (Cbpt) transcriptionally up-regulates haem oxygenase (HO)-1 through a nuclear factor of activated T-lymphocyte-3 (NFAT3)-dependent mechanism. (A) Renal tubular cells (RTC) were treated with increasing concentrations of carboplatin as indicated for 6 h for the reverse-transcription polymerase chain reaction (RT-PCR) analysis of HO-1 induction and 18 h for the Western blot analysis of HO-1 and cleaved caspase-3. (B) RTC were transiently transfected for 24 h with the pGL3/rat HO-1 promoter containing NFAT binding sites. This was followed by the indicated concentrations of carboplatin treatment for 4 h. Data are presented as the mean ± SEM of three independent experiments (*P < 0.05, significantly different from RTC alone). (C) The putative NFAT-binding activity derived from the HO-1 promoter region of nuclear proteins was assayed for 1 h by electrophoretic mobility shift assay (EMSA) in cells with the indicated concentrations of carboplatin treatment. The 100× cold denotes a 100-fold molar excess of unlabeled oligonucleotides relative to the biotin-labeled probe. This was added to the binding assay for competition with the unlabeled oligonucleotide. The mobility of specific NFAT complexes is indicated. (D) Cells with 1 h of indicated carboplatin treatment were subjected to a chromatin immunoprecipitation (ChIP) assay. The DNA associated with the NFAT3 was immunoprecipitated with an anti-NFAT3 antibody, and PCR amplification was used to determine the extent of NFAT3 association with the functional NFAT3 in an HO-1 promoter fragment of 176 bp. Double-distilled water and anti-Tu were, respectively, used as negative controls for the ChIP assay. Representative results of three separate experiments are shown, and data are presented as the mean ± SEM. *P < 0.05, significantly different from the control; #P < 0.05, significantly different from carboplatin alone). (E) Cells were transfected with siNFAT3 for 24 h, followed by 1 or 6 h of 200 µM carboplatin treatment for the RT-PCR and Western blot analysis of NFAT3 and HO-1, respectively. Data are presented as the mean ± SEM of three independent experiments. *P < 0.05, significantly different from RTC alone; #P < 0.05, significantly different from knockdown of NFAT3 in RTC with additional carboplatin treatment.
