
Figure 5.
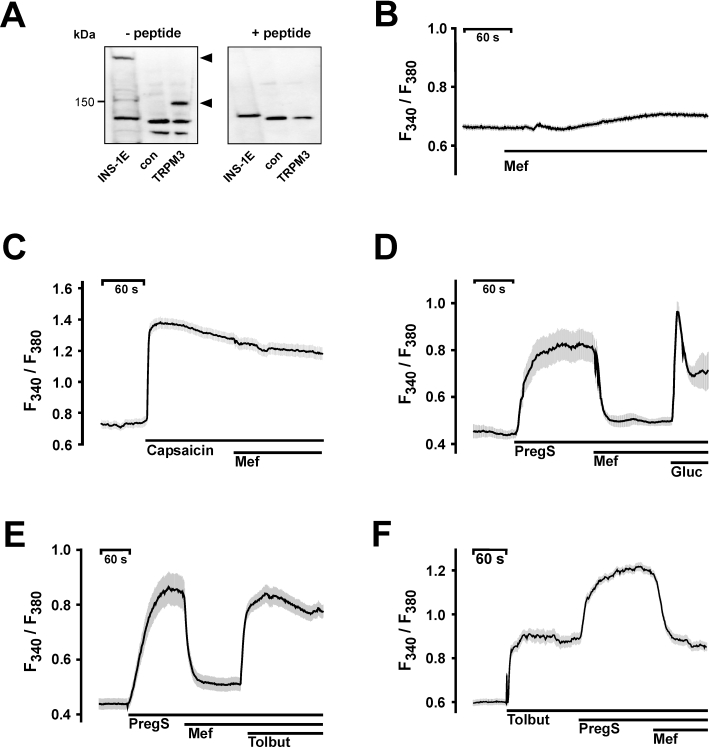
Effects of mefenamic acid on pancreatic β-cells. A. Western blot analysis of membranes extracted from INS-1E cells, HEK293 control cells (con) and TRPM3-expressing HEK293 cells (TRPM3). The anti-TRPM3 antibody detected two bands of approx. 150 and 220 kDa (left panel, – peptide). In the presence of the immunogenic peptide the TRPM3-specific signals were absent (right panel, +peptide). B–F. Changes in [Ca2+]i are depicted by the fluorescence ratios F340/F380 of Fura-2-loaded INS-1E cells. B. Application of mefenamic acid (Mef) did not alter intracellular calcium concentrations. C. Application of capsaicin (100 nM) resulted in a pronounced increase in calcium which was unaffected by mefenamic acid. D. Measurement of [Ca2+]i of INS-1E cells after stimulation with 35 µM pregnenolone sulphate and block with 30 µM mefenamic acid. An additional stimulus with 20 mM glucose (Gluc) in the presence of 35 µM pregnenolone sulphate and 30 µM mefenamic acid triggered a second increase in [Ca2+]i. E. Mefenamic acid had no effect on voltage-gated calcium channels activated by 100 µM tolbutamide (Tolbut) after blocking pregnenolone sulphate (35 µM)-stimulated INS-1E cells. F. Tolbutamide (100 µM) increased the [Ca2+]i of INS-1E cells. The application of 35 µM pregnenolone sulphate further enhanced [Ca2+]i, an effect reversed by mefenamic acid. The black lines indicate mean values from at least four independent experiments with at least 20 cells each. The shaded areas depict the SEM for each data point.