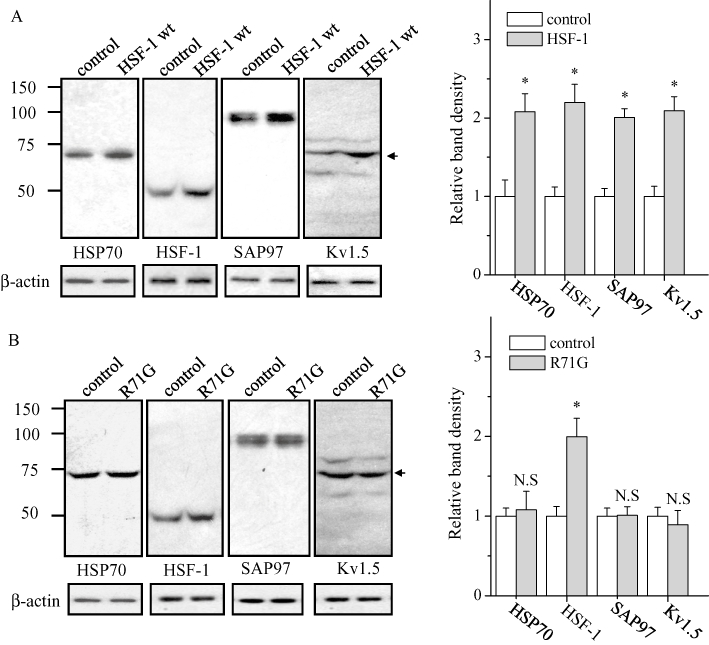
Figure 2.

HSF-1 regulation of the expression of HSP70, HSF-1, SAP97 and Kv1.5 proteins. HL-1 cells were transfected with wild-type (Wt) HSF-1 (A) and mutant R71G (B) plasmids and analysed by Western blotting using anti-HSP70, HSF-1, SAP97 and Kv1.5 antibodies (left). The blots at the bottom were reprobed with anti-β-actin as internal control. The mean ratio (±SEM) of each protein level normalized to β-actin (n = 6 for control and transfected groups) is shown (right). Statistical significance of the differences among each group was tested by Student's t-test: *P < 0.05; N.S. = not statistically significant.
