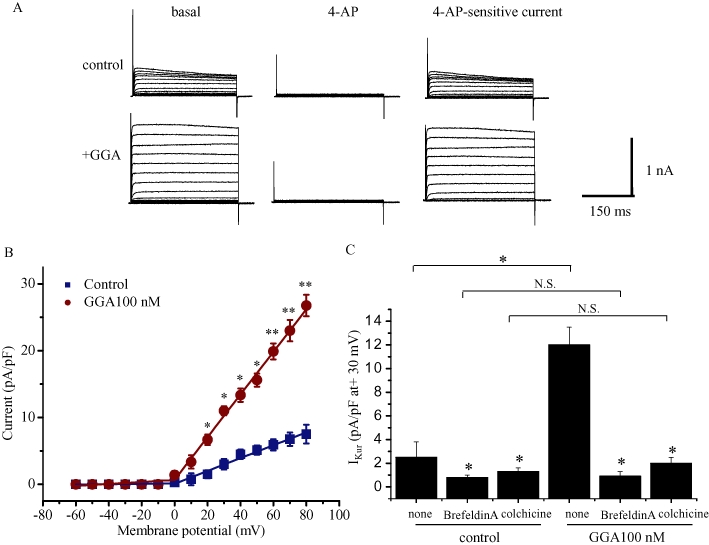
Figure 10.

Effects of GGA on IKur in COS7 cells transfected with Kv1.5-FLAG channels. (A) Representative current traces from COS7 cells treated with GGA 100 nM or vehicle control (0.01% ethanol) for 12 h. The currents were elicited by 500 ms test pulses ranging from −60 to +80 mV (in 10 mV increments). The holding potential was −60 mV. Right panels show the 4-AP sensitive currents obtained by subtracting the currents recorded in the presence of 1 mM 4-AP (middle) from those recorded in the absence of 4-AP (left). (B) Current–voltage relationships of 4-AP-sensitive currents in the presence and absence of GGA. The peak amplitudes of the currents are presented as the mean ratio (±SEM) (pA/pF) (n = 21 for control and GGA 100 nM groups). Statistical significance of the differences among each group was tested by Student's t-test: *P < 0.05, **P < 0.01. C. Effect of brefeldin A and colchicine on GGA 100 nM-induced increases in IKur currents elicited by 500 ms test pulse to +30 mV. Cells were treated with brefeldin A or colchicine (both at 5 µM for 12 h) before determination of IKur currents in the presence of GGA 100 nM (n = 12 for control and each treatment groups). Statistical significance of the differences among each group was tested by Student's t-test: *P < 0.05, N.S. = not statistically significant. GGA, geranylgeranylacetone.
