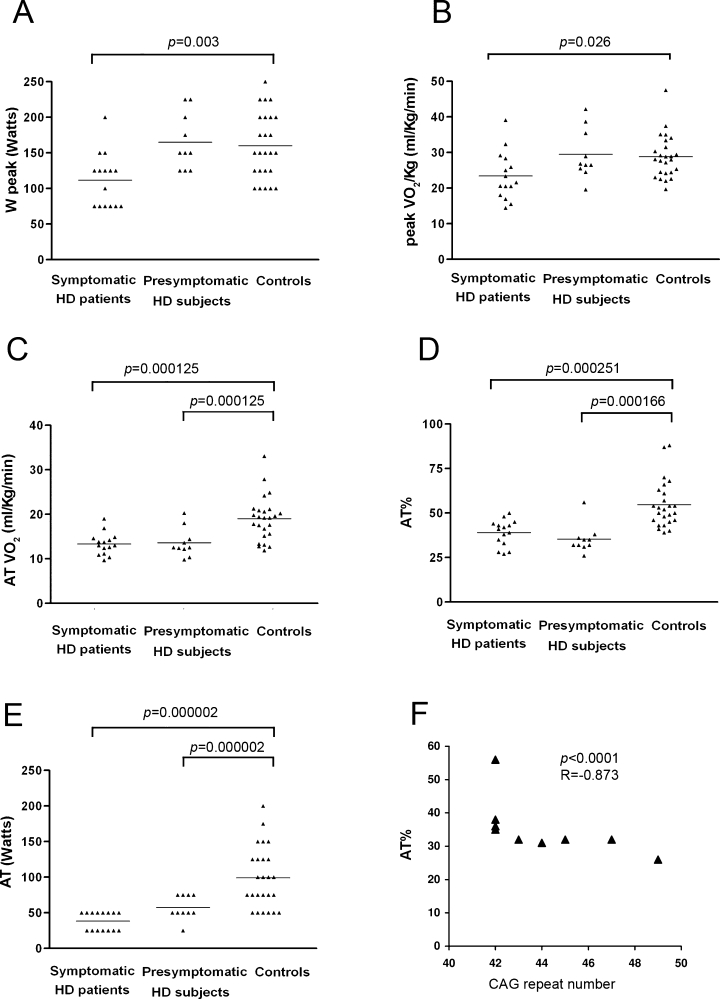
FIG. 1.

(A) Scatter plot of maximal ergometric working capacity values (Wpeak) and (B) maximal oxygen consumption, expressed as absolute values (Peak VO2) in HD patients (N = 15), presymptomatic subjects (N = 10) and control subjects (N = 25). (C) Scatter plot of aerobic threshold values expressed as absolute value (ATVO2), (D) as percent of the predicted maximum (AT%) and (E) as Watts reached (AT Watts). Mean values are indicated with horizontal bars. (F) Scatter plot graph showing that AT% correlates with CAG repeat number in presymptomatic HD subjects. The graph shows nine dots because two subjects had identical AT% and CAG repeat number.
