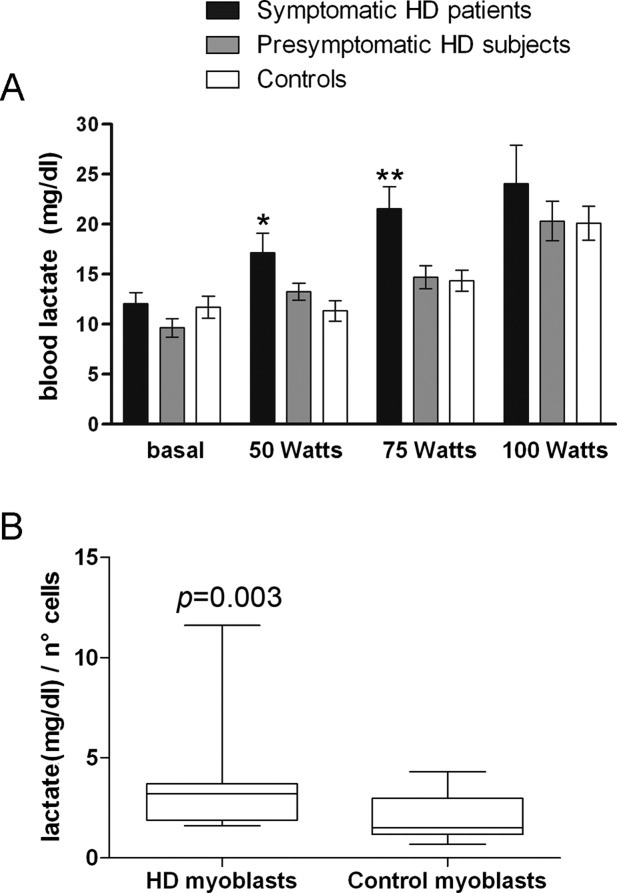
FIG. 2.

(A) Lactate concentrations in blood (mean ± SD) during cardiopulmonary test (*P = 0.021; **P = 0.014 vs. controls). (B) Graph representing the median and the percentiles of lactate concentrations in cell culture media. Data were expressed as mg/dL and normalized on cell number. The ends of the boxes define the 25th and 75th percentiles, with a line at the median and error bars defining the 10th and 90th percentiles. Medians were: HD cells 3.0 mg/dL/number of cells. Control cells: 1.6 mg/dL/number of cells (P = 0.003 vs. control cells).
