
Figure 2.
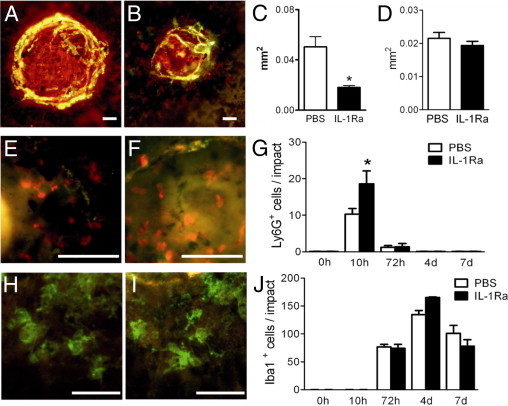
IL-1Ra inhibits CNV independently of macrophage recruitment. Photographs of isolectin (red) stained and fluorescein dextran perfused (green) RPE/choroidal flatmounts of PBS-treated (A; n = 4) and IL-1Ra–treated (B; n = 5) C57BL/6 mice 14 days after laser injury. Quantification of fluorescein-positive area (C; Mann-Whitney *P < 0.0001). Quantification of RPE lesion size of PBS- (n = 4 mice) and IL-1Ra– (n = 4 mice) treated mice at 10 hours after laser impact (D). Representative photographs of Ly6G- (red) and Iba1- (green) stained RPE/choroidal flatmounts of the border of the injured area of saline- (E and H; n = 3 mice/group) and IL-1Ra–treated (F and I; n = 3 mice/group) mice 10 hours (E and F) and 72 hours (H and I) after laser injury. Quantification of Ly6G- (G) and Iba1- (J) positive cells/impact at different time points (F; Mann-Whitney *P = 0.14). Scale bars = 50 μm (A, B, E, F, H, and I).