
Figure 1.
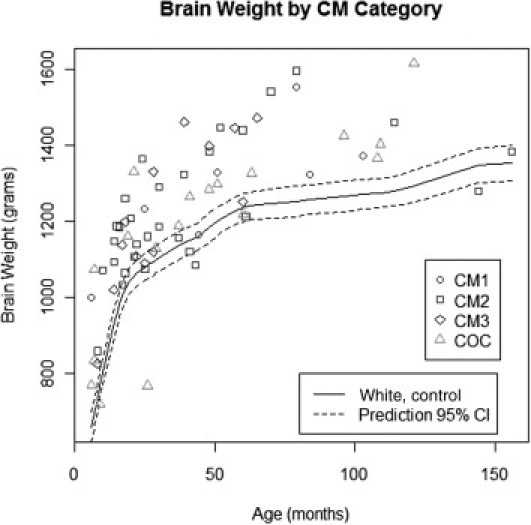
Brain weights of children in the CM1, CM2, CM3, and COC groups compared with the normal brain weights of age-matched white children. The brain weights of most children in the CM1, CM2, and, to a lesser extent, CM3 groups are higher than the normal values. CI indicates confidence interval.