
Figure 6.
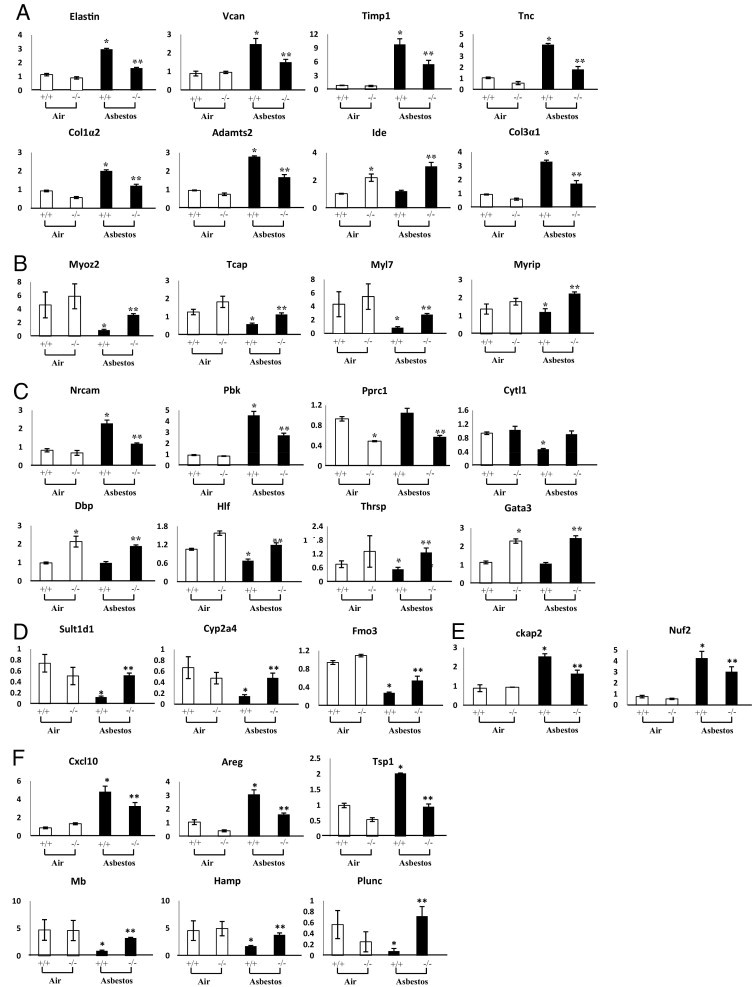
Expression profiles of select genes, by functional category. Data are reported as fold change relative to OPN+/+ air-exposed animals. A: Extracellular matrix. B: Cytoskeleton/muscle contraction. C: Cell signaling. D: Biotransformation. E: Cell cycle. F: Immune system/defense. *P ≤ 0.05, asbestos versus air exposure; **P ≤ 0.05, asbestos-exposed OPN+/+ versus OPN−/−.