
Figure 2.
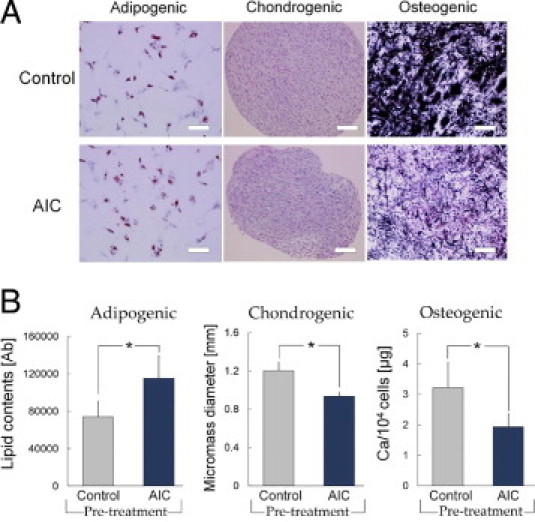
AIC effects on the differentiation capacity of hASCs into adipogenic, chondrogenic, and osteogenic lineages. A: After incubation in EBM with or without AIC for 3 days, hASCs were cultured in separate differentiation media. Representative microscopic images from each assay are shown. Lipid droplets were stained in red (oil red O staining) in adipocytes, chondrogenic micromass was visualized with Alcian blue staining, and Ca deposits in osteocytes were stained in black with von Kossa staining. Scale bars = 100 μm. B: Quantitative analyses of cell differentiation (n = 6). The hASC differentiation capacity was evaluated by measuring lipid droplet content (adipogenic), micromass diameter (chondrogenic), or total calcium content (osteogenic). *P < 0.05. Error bars represent SEM.