
Figure 5.
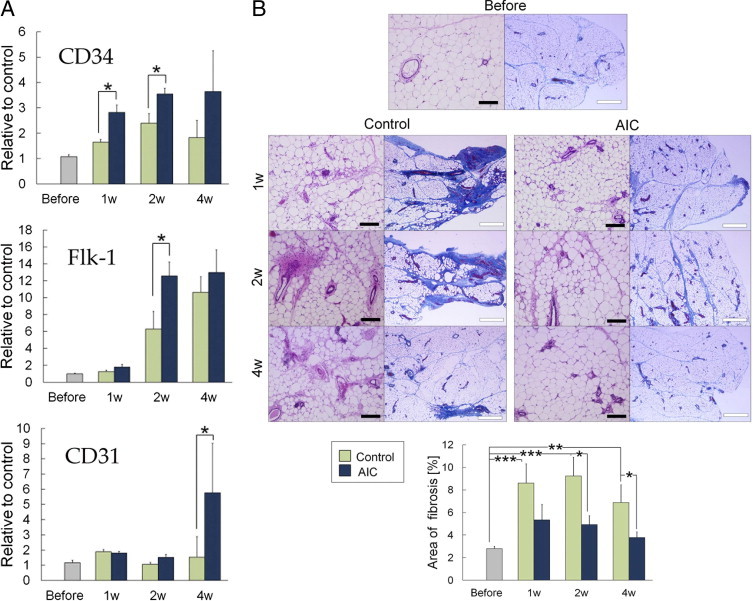
AIC effects on adipose tissue with acute ischemia, part II. A: Whole inguinal adipose tissue was homogenized, and mRNA expressions were examined using real-time PCR analysis (n = 3). B: Representative histologic assessment and quantification of fibrous areas (n = 6) with azan-stained sections. *P < 0.05; **P < 0.01; ***P < 0.001. Error bars represent SEM. Black bar indicates 200 μm; white bar indicates 500 μm.