
Figure 7.
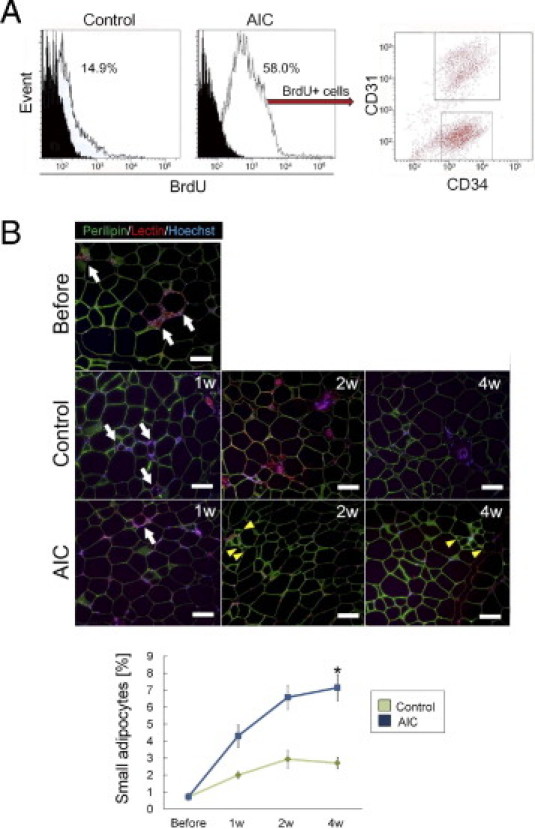
AIC effects on diabetic adipose tissue with chronic hypoxia, part II. A: Flow cytometric analysis of freshly isolated stromal vascular fraction from diabetic adipose tissue. The histograms of CD45– cells represent the proportion of BrdU+ cells in vehicle-treated tissue (left) or in AIC-treated tissue (right). B: Immunohistochemical staining images. The sections were stained with perilipin (viable adipocytes; green), lectin (ECs; blue), and Hoechst 33342 (nuclei; blue). Perilipin-negative adipocytes surrounded by macrophages (so-called crown-like structure; white arrows), suggesting degenerated adipocytes, were occasionally observed. The proportion of perilipin-positive small-sized adipocytes (yellow arrowheads), suggesting ongoing adipogenesis, was counted and calculated (n = 4). *P < 0.05. Scale bars = 100 μm. Error bars represent SEM.