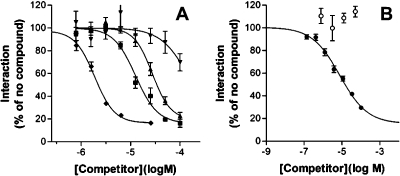
Figure 3.
Biological activity of peptide and small-molecule annexin A2−S100A10 inhibitors. (A) Dose−response curves for the 14-residue N-terminal annexin A2 peptide (⧫) and compounds 1a (▲), 47 (◼), and 50 (▼) in the FRET-based competitive annexin A2−S100A10 binding assay are shown. Curve fit was performed in Graphpad Prism as described in Table 1. Error bars represent the standard error of the mean of four (compounds) or eight (peptide) observations. (B) As under A except that compound 27 (●; n = 28 ± standard error of the mean) or 22 (○; n = 4 ± standard error of the mean) was analyzed.

