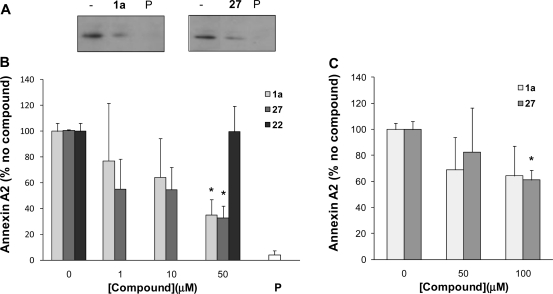
Figure 4.
Analysis of the native complex of S100A10 and annexin A2. (A) MDA-MB-231 cells were lysed and incubated with 50 μM compound as indicated or with the annexin A2 N terminus peptide (P). S100A10 was immunoprecipitated, and the amount of annexin A2 in the immunoprecipitates was analyzed by SDS-PAGE followed by Western blotting using an annexin A2 antibody. Annexin A2 was identified based upon comigration with an annexin A2 reference on the blot. The section of the blot with the annexin A2 signal is shown. (B) MDA-MB-231 cells were lysed and incubated with compound at concentrations as indicated or with the annexin A2 N terminus peptide (P). Western blots were obtained and scanned, and scans were quantified using Scion Image software. Quantified data were expressed as % of nontreated control. Error bars represent the standard error of the mean (n = 3 from three separate lysates). (C) As in B, except that MDA-MB-231 cells were treated with compound for 6 h after which the cells were lysed and washed, and immunoprecipitations were performed as above. Error bars represent the standard error of the mean (n = 3 from three separate lysates). *p < 0.05 (nonpaired t test).

