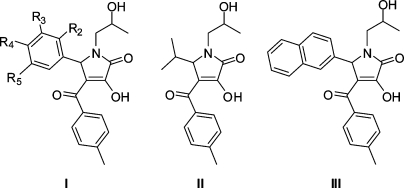
Table 2. Inhibition of the S100A10 Interaction with Annexin A2 by 5-Substituted 3-Hydroxy-1-(2-hydroxypropyl)-4-(4-methylbenzoyl)-1H-pyrrol-2(5H)-ones and Activity in Counterscreen Assay.
| annexin−S100A10 interaction |
counterscreen | |||||||
|---|---|---|---|---|---|---|---|---|
| no. | type | R2 | R3 | R4 | R5 | pIC50a | IC50 (μM) | % controlb |
| P | 5.99 ± 0.10 | 1 | ||||||
| 1a | I | H | H | iPr | H | 4.85 ± 0.09 | 14 | 101 ± 7 |
| 13 | II | <3 | >1000 | |||||
| 14 | III | 3.89 ± 0.15* | 128 | |||||
| 15 | I | H | H | H | H | 3.60 ± 0.33* | 251 | |
| 16 | I | H | iPr | H | H | 4.94 ± 0.14 | 11 | 100 ± 16 |
| 17 | I | H | H | Me | H | 4.07 ± 0.10* | 85 | |
| 18 | I | H | H | Et | H | 4.80 ± 0.25 | 16 | |
| 19 | I | H | H | nPr | H | 4.74 ± 0.09 | 18 | 97 ± 9 |
| 20 | I | H | H | tBu | H | 4.55 ± 0.05** | 28 | 123 ± 7 |
| 21 | I | H | H | NMe2 | H | 3.56 ± 0.55* | 275 | |
| 22 | I | H | H | OH | H | <3 | >1000 | |
| 23 | I | H | H | OCF3 | H | 5.02 ± 0.11 | 9 | 110 ± 8 |
| 24 | I | H | H | CF3 | H | 5.20 ± 0.36 | 6 | 102 ± 1 |
| 25 | I | H | CF3 | H | H | 5.08 ± 0.09 | 8 | 110 ± 6 |
| 26 | I | CF3 | H | CF3 | H | 5.12 ± 0.09 | 8 | 102 ± 6 |
| 27 | I | H | CF3 | H | CF3 | 5.41 ± 0.12 | 4 | 109 ± 3 |
| 28 | I | H | H | Cl | H | 3.93 ± 0.21* | 117 | |
| 29 | I | H | Cl | H | H | 3.98 ± 0.15* | 105 | |
| 30 | I | H | Cl | H | Cl | 5.16 ± 0.15 | 7 | 119 ± 4 |
| 31 | I | H | CF3 | Cl | H | 5.12 ± 0.06 | 8 | 121 ± 11 |
Data were expressed as % of the specific signal of the nontreated control and analyzed by nonlinear regression using Graphpad Prism. pIC50 ± standard error of the fit (n = 4−8 data points per concentration, 0.4−100 μM). The midpoint of the dose−response curve is given based on a floating fit unless indicated as follows: *, bottom fixed at zero; **, bottom fixed at zero, top fixed at 100%.
Percent remaining signal at 50 μM compound relative to diluent only (mean ± standard error mean of >3 determinations). P = nonlabeled synthetic annexin N terminus peptide.

