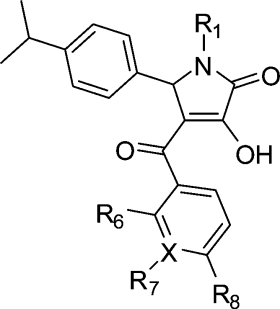
Table 3. Inhibition of the S100A10 Interaction with Annexin A2 by 1-Substituted 4-Aroyl-3-hydroxy-5-(4-isopropylphenyl)-1H-pyrrol-2(5H)-ones and Activity in Counterscreen Assay.
| annexin−S100A10 interaction |
counterscreen | |||||||
|---|---|---|---|---|---|---|---|---|
| no. | R1 | R6 | R7 | R8 | X | pIC50a | IC50 (μM) | % controlb |
| 1a | CH2CHMeOH | H | H | Me | C | 4.85 ± 0.09 | 14 | 101 ± 7 |
| 32 | iBu | H | H | Me | C | <3 | >1000 | |
| 33 | CH2CH2OH | H | H | Me | C | 4.92 ± 0.16 | 12 | 101 ± 6 |
| 34 | CH2CH2OMe | H | H | Me | C | 5.12 ± 0.16 | 8 | 120 ± 11 |
| 35 | CH2(CH2)2OMe | H | H | Me | C | 5.54 ± 0.27 | 3 | 111 ± 19 |
| 36 | CH2CH=CH2 | H | H | Me | C | 5.19 ± 0.05** | 6 | 105 ± 14 |
| 37 | CH2CHMeOH | H | H | H | C | 4.84 ± 0.14 | 14 | |
| 38 | CH2CHMeOH | H | Me | H | C | 4.10 ± 0.10* | 79 | |
| 39 | CH2CHMeOH | H | H | OMe | C | 3.21 ± 0.35* | 616 | |
| 40 | CH2CHMeOH | H | OMe | H | C | 5.16 ± 0.05 | 7 | 110 ± 3 |
| 41 | CH2CHMeOH | OEt | H | H | C | 5.15 ± 0.11 | 7 | 112 ± 11 |
| 42 | CH2CHMeOH | H | - | Me | N | 3.10 ± 0.01* | 794 | |
| 43 | CH2CHMeOH | H | H | CN | C | 4.25 ± 0.31 | 56 | |
| 44 | CH2CHMeOH | H | H | Cl | C | 5.57 ± 0.86 | 3 | 126 ± 5 |
Data were expressed as % of the specific signal of the nontreated control and analyzed by nonlinear regression using Graphpad Prism. pIC50 ± standard error of the fit (n = 4−8 data points per concentration, 0.4−100 μM). The midpoint of the dose−response curve is given based on a floating fit unless indicated as follows: *, bottom fixed at zero; **, bottom fixed at zero, top fixed at 100%.
Percent remaining signal at 50 μM compound relative to diluent only (mean ± standard error mean of >3 determinations).

